A tool to rebalance uneven Ceph pools

The algorithm to fix uneven CRUSH distributions in Ceph was implemented as the crush optimize subcommand. Given the output of ceph report, crush analyze can show buckets that are over/under filled:

$ ceph report > ceph_report.json
$ crush analyze --crushmap ceph_report.json --pool 3
             ~id~  ~weight~  ~PGs~  ~over/under filled %~
~name~
cloud3-1363    -6    419424   1084                   7.90
cloud3-1364    -7    427290   1103                   7.77
cloud3-1361    -4    424668   1061                   4.31
cloud3-1362    -5    419424   1042                   3.72
cloud3-1359    -2    419424   1031                   2.62
cloud3-1360    -3    419424    993                  -1.16
cloud3-1396    -8    644866   1520                  -1.59
cloud3-1456   -11    665842   1532                  -3.94
cloud3-1397    -9    644866   1469                  -4.90
cloud3-1398   -10    644866   1453                  -5.93

Worst case scenario if a host fails:

        ~over filled %~
~type~
device            30.15
host              10.53
root               0.00

The crush optimize command will create a crushmap rebalancing the PGs:

$ crush optimize --crushmap ceph_report.json \
                 --out-path optimized.crush --pool 3
2017-05-27 20:22:17,638 argv = optimize --crushmap ceph_report.json \
  --out-path optimized.crush --pool 3 --replication-count=3 \
  --pg-num=4096 --pgp-num=4096 --rule=data --out-version=j \
  --no-positions --choose-args=3
2017-05-27 20:22:17,670 default optimizing
2017-05-27 20:22:24,165 default wants to swap 447 PGs
2017-05-27 20:22:24,172 cloud3-1360 optimizing
2017-05-27 20:22:24,173 cloud3-1359 optimizing
2017-05-27 20:22:24,174 cloud3-1361 optimizing
2017-05-27 20:22:24,175 cloud3-1362 optimizing
2017-05-27 20:22:24,177 cloud3-1364 optimizing
2017-05-27 20:22:24,177 cloud3-1363 optimizing
2017-05-27 20:22:24,179 cloud3-1396 optimizing
2017-05-27 20:22:24,188 cloud3-1397 optimizing
2017-05-27 20:22:27,726 cloud3-1360 wants to swap 21 PGs
2017-05-27 20:22:27,734 cloud3-1398 optimizing
2017-05-27 20:22:29,151 cloud3-1364 wants to swap 48 PGs
2017-05-27 20:22:29,176 cloud3-1456 optimizing
2017-05-27 20:22:29,182 cloud3-1362 wants to swap 32 PGs
2017-05-27 20:22:29,603 cloud3-1361 wants to swap 47 PGs
2017-05-27 20:22:31,406 cloud3-1396 wants to swap 77 PGs
2017-05-27 20:22:33,045 cloud3-1397 wants to swap 61 PGs
2017-05-27 20:22:33,160 cloud3-1456 wants to swap 58 PGs
2017-05-27 20:22:33,622 cloud3-1398 wants to swap 47 PGs
2017-05-27 20:23:51,645 cloud3-1359 wants to swap 26 PGs
2017-05-27 20:23:52,090 cloud3-1363 wants to swap 43 PGs

Before uploading the crushmap (with ceph osd setcrushmap -i optimized.crush), crush analyze can be used again to verify it improved as expected:

$ crush analyze --crushmap optimized.crush --pool 3 --replication-count=3 \
                --pg-num=4096 --pgp-num=4096 --rule=data --choose-args=0
             ~id~  ~weight~  ~PGs~  ~over/under filled %~
~name~
cloud3-1359    -2    419424   1007                   0.24
cloud3-1363    -6    419424   1006                   0.14
cloud3-1360    -3    419424   1005                   0.04
cloud3-1361    -4    424668   1017                  -0.02
cloud3-1396    -8    644866   1544                  -0.04
cloud3-1397    -9    644866   1544                  -0.04
cloud3-1398   -10    644866   1544                  -0.04
cloud3-1364    -7    427290   1023                  -0.05
cloud3-1456   -11    665842   1594                  -0.05
cloud3-1362    -5    419424   1004                  -0.06

Worst case scenario if a host fails:

        ~over filled %~
~type~
device            11.39
host               3.02
root               0.00
Continue reading “A tool to rebalance uneven Ceph pools”

An algorithm to fix uneven CRUSH distributions in Ceph

The current CRUSH implementation in Ceph does not always provide an even distribution.

The most common cause of unevenness is when only a few thousands PGs, or less, are mapped. This is not enough samples and the variations can be as high as 25%. For instance, when there are two OSDs with the same weight, distributing randomly four PGs among them may lead to one OSD having three PGs and the other only one. This problem would be resolved by having at least thousands of PGs per OSD, but that is not recommended because it would require too many resources.

The other cause of uneven distribution is conditional probability. For a two-replica pool, PGs are mapped to OSDs that must be different: the second OSD is chosen at random, on the condition that it is not the same as the first OSD. When all OSDs have the same probability, this bias is not significant. But when OSDs have different weights it makes a difference. For instance, given nine OSDs with weight 1 and one OSD with weight 5, the smaller OSDs will be overfilled (from 7% to 10%) and the bigger OSD will be ~15% underfilled.

The proposed algorithm fixes both cases by producing new weights that can be used as a weight set in Luminous clusters.

For a given pool the input parameters are:

  • pool size
  • numeric id
  • number of PGs
  • root of the CRUSH rule (take step)
  • the CRUSH rule itself
   for size in [1,pool size]
     copy all weights to the size - 1 weight set
     recursively walk the root
     for each bucket at a given level in the hierarchy
       repeat until the difference with the expected distribution is small
         map all PGs in the pool, with size instead of pool size
         in the size - 1 weight set
           lower the weight of the most overfilled child
           increase  the weight of the most underfilled child

It is common to change the size of a pool in a Ceph cluster. When increasing the size from 2 to 3, the user expects the existing objects to stay where they are, with new objects being created to provide an additional replica. To preserve this property while optimizing the weights, there needs to be a different weight set for each possible size. This is what the outer loop (for size in [1,pool size]) does.

If the distribution is not as expected at the highest level of the hierarchy, there is no way to fix that at the lowest levels. For instance if a host receives 100 more PGs that it should, the OSDs it contains will inevitably be overfilled. This is why the optimization proceeds from the top of the hierarchy.

When a bucket is given precisely the expected number of PGs and fails to distribute them evenly among its children, the children’s weights can be modified to get closer to the ideal distribution. Increasing the weight of the most underfilled item will capture PGs from the other buckets. And decreasing the weight of the most overfilled will push PGs out of it. A simulation is run to determine precisely which PGs will be distributed to which item because there is no known mathematical formula to calculate that. This is why all PGs are mapped to determine which items are over- or underfilled.

Continue reading “An algorithm to fix uneven CRUSH distributions in Ceph”

Ceph space lost due to overweight CRUSH items

When a CRUSH bucket contains five Ceph OSDs with the following weights:

      weight
osd.0   5
osd.1   1
osd.2   1
osd.3   1
osd.4   1

20% of the space in osd.0 will never be used by a pool with two replicas.

The osd.0 gets 55% of the values for the first replica (i.e 5 / 9), as expected. But osd.0 can only get 45% for the second replica, because that is all there is left.

The upper bound for the weight of an item within a bucket that contains either devices or items designated to be the failure domain can be calculated as follows:

  • N is the number of replicas
  • O is the number of overweight items, i.e. items that have a weight greater than (sum of the weights)/N
  • the effective weight of all overweight items is equal to (sum of the weights of non-overweight items) / (N – O)

In the example above, the effective weight of osd.0 is therefore ( 1 + 1 + 1 + 1) / ( 2 – 1 ) = 4.

The crush analyze command detects weights that are above the maximum and uses their effective weight to get meaningful results. For instance:

$ crush analyze ...
        ~id~  ~weight~  ~objects~  ~over/under filled %~
~name~
osd.3      5         1        646                26.17
osd.4      6         1        610                19.14
osd.2      4         1        575                12.30
osd.1      3         1        571                11.52
osd.0      2         5       1694               -37.29

Worst case scenario if a osd fails:

        ~overfilled %~
~type~
osd             21.14
root             0.00

The following are overweight and should be cropped:

        ~id~  ~weight~  ~cropped weight~  ~cropped %~
~name~
osd.0      2         5               4.0         20.0

The osd.0 is reported to be 37.29% underfilled but 20% of that amount comes from the fact that the item is overweight. The remaining 17.29% come from the conditional probability bias and random noise due to a low number of objects.

Ceph full ratio and uneven CRUSH distributions

A common CRUSH rule in Ceph is

    step chooseleaf firstn 0 type host

meaning Placement Groups (PGs) will place replicas on different hosts so the cluster can sustain the failure of any host without losing data. The missing replicas are then restored from the surviving replicas (via a process called “backfilling”) and placed on the remaining hosts.

To make sure there is enough space in the cluster to cope with the failure of a host, a certain percentage of free space in the cluster is reserved (from the beginning) and never used. This percentage needs to be adjusted to take into account the most overfull OSD in case the PG distribution is not even.

For instance, in a cluster with five hosts containing two identical disks each, reserving 20% plus 6.45% to account for the most overfull OSD displayed below should be enough:

crush analyze --type device --rule data \
              --replication-count 2 \
              --crushmap mymap.txt \
              --pool 0 --pg-num 1024 --pgp-num 1024
         ~id~  ~weight~  ~objects~  ~over/under used %~
~name~
device9     9       1.0        218                 6.45
device5     5       1.0        214                 4.49
device7     7       1.0        214                 4.49
device0     0       1.0        212                 3.52
device8     8       1.0        212                 3.52
device6     6       1.0        208                 1.56
device2     2       1.0        201                -1.86
device3     3       1.0        201                -1.86
device4     4       1.0        192                -6.25
device1     1       1.0        176               -14.06

However this uneven distribution will be different when a host is removed, because that causes a change in the most overfull OSD – and the new most overfull OSD may even be worse (more overfull) than the previous one. In our example cluster, device9 was the most (6.45%) overfull. If the host containing device8 and device9 is removed, device5 becomes the most overfull OSD, and it is worse (8.98%):

         ~id~  ~weight~  ~objects~  ~over/under used %~
~name~
device5     5       1.0        279                 8.98
device7     7       1.0        270                 5.47
device2     2       1.0        268                 4.69
device0     0       1.0        267                 4.30
device3     3       1.0        249                -2.73
device6     6       1.0        246                -3.91
device1     1       1.0        241                -5.86
device4     4       1.0        228               -10.94

It would therefore be better to reserve 28.98% instead of 26.45% to make sure the cluster does not become too full after a host failure. To help with that, the crush analyze command was modified to display the worst case scenario for each bucket type in the crushmap:

crush analyze --type device --rule data \
              --replication-count 2 \
              --crushmap mymap.txt \
              --pool 0 --pg-num 1024 --pgp-num 1024
         ~id~  ~weight~  ~objects~  ~over/under used %~
~name~
device9     9       1.0        218                 6.45
device5     5       1.0        214                 4.49
device7     7       1.0        214                 4.49
device0     0       1.0        212                 3.52
device8     8       1.0        212                 3.52
device6     6       1.0        208                 1.56
device2     2       1.0        201                -1.86
device3     3       1.0        201                -1.86
device4     4       1.0        192                -6.25
device1     1       1.0        176               -14.06

Worst case scenario if a host fails:

        ~over used %~
~type~
device           8.98
host             4.49
root             0.00

Improving PGs distribution with CRUSH weight sets

In a Ceph cluster with a single pool of 1024 Placement Groups (PGs), the PG distribution among devices will not be as expected. (see Predicting Ceph PG placement for details about this uneven distribution).

In the following, the difference between the expected number of PGs on a given host or device and the actual number of PGs can be as high as 25%. For instance, device4 has a weight of 1 and is expected to get 128 PGs but it only gets 96. And host2 (containing device4) has 83 less PGs than expected.

         ~expected~  ~actual~  ~delta~   ~delta%~  ~weight~
dc1            1024      1024        0   0.000000       1.0
 host0          256       294       38  14.843750       2.0
  device0       128       153       25  19.531250       1.0
  device1       128       141       13  10.156250       1.0
 host1          256       301       45  17.578125       2.0
  device2       128       157       29  22.656250       1.0
  device3       128       144       16  12.500000       1.0
 host2          512       429      -83 -16.210938       4.0
  device4       128        96      -32 -25.000000       1.0
  device5       128       117      -11  -8.593750       1.0
  device6       256       216      -40 -15.625000       2.0

Using minimization methods it is possible to find alternate weights for hosts and devices that significantly reduce the uneven distribution, as shown below.

         ~expected~  ~actual~  ~delta~  ~delta%~  ~weight~
dc1            1024      1024        0  0.000000  1.000000
 host0          256       259        3  1.171875  0.680399
  device0       128       129        1  0.781250  0.950001
  device1       128       130        2  1.562500  1.050000
 host1          256       258        2  0.781250  0.646225
  device2       128       129        1  0.781250  0.867188
  device3       128       129        1  0.781250  1.134375
 host2          512       507       -5 -0.976562  7.879046
  device4       128       126       -2 -1.562500  1.111111
  device5       128       127       -1 -0.781250  0.933333
  device6       256       254       -2 -0.781250  1.955555

For each host or device, we now have two weights. First, there is the target weight which is used to calculate the expected number of PGs. For instance, host0 should get 1024 * (target weight host0 = 2 / (target weight host0 = 2 + target weight host1 = 2 + target weight host3 = 4)) PGs, that is 1024 * ( 2 / ( 2 + 2 + 4 ) ) = 256. The second weight is weight set, which is used to choose where a PGs is mapped.

The problem is that the crushmap format only allows one weight per host or device. Although it would be possible to store the target weight outside of the crushmap, it would be inconvenient and difficult to understand. Instead, the crushmap syntax was extended to allow additional weights (via weight set) to be associated with each item (i.e. disk or host in the example below).

                                                    target
         ~expected~  ~actual~  ~delta~   ~delta%~  ~weight~ ~weight set~
dc1            1024      1024        0   0.000000       1.0     1.000000
 host0          256       294       38  14.843750       2.0     0.680399
  device0       128       153       25  19.531250       1.0     0.950001
  device1       128       141       13  10.156250       1.0     1.050000
 host1          256       301       45  17.578125       2.0     0.646225
  device2       128       157       29  22.656250       1.0     0.867188
  device3       128       144       16  12.500000       1.0     1.134375
 host2          512       429      -83 -16.210938       4.0     7.879046
  device4       128        96      -32 -25.000000       1.0     1.111111
  device5       128       117      -11  -8.593750       1.0     0.933333
  device6       256       216      -40 -15.625000       2.0     1.955555

Continue reading “Improving PGs distribution with CRUSH weight sets”

Faster Ceph CRUSH computation with smaller buckets

The CRUSH function maps Ceph placement groups (PGs) and objects to OSDs. It is used extensively in Ceph clients and daemons as well as in the Linux kernel modules and its CPU cost should be reduced to the minimum.

It is common to define the Ceph CRUSH map so that PGs use OSDs on different hosts. The hierarchy can be as simple as 100 hosts, each containing 7 OSDs. When determining which OSDs belong to a given PG, in this scenario the CRUSH function will hash each of the 100 hosts to the PG, compare the results, and select the OSDs that score the highest. That is 100 + 7 calls to the hash function.

If the hierarchy is modified to have 20 racks, each containing 5 hosts with 7 OSDs per host, we only have 20 + 5 + 7 calls to the hash function. The first 20 calls are to select the rack, the next 5 to select the host in the rack and the last 7 to select the OSD within the host.

In other words, this hierarchical subdivision of the CRUSH map reduces the number of calls to the hash function from 107 to 32. It does not have any influence on how the PGs are mapped to OSDs but it saves CPU.

Predicting Ceph PG placement

When creating a new Ceph pool, deciding for the number of PG requires some thinking to ensure there are a few hundred PGs per OSD. The distribution can be verified with crush analyze as follows:

$ crush analyze --rule data --type device \
                --replication-count 2 \
                --crushmap crushmap.txt \
                --pool 0 --pg-num 512 --pgp-num 512
         ~id~  ~weight~  ~over/under used %~
~name~
device0     0       1.0                 9.86
device5     5       2.0                 8.54
device2     2       1.0                 1.07
device3     3       2.0                -1.12
device1     1       2.0                -5.52
device4     4       1.0               -14.75

The argument of the –pool option is unknown because the pool was not created yet, but pool numbers are easy to predict. If the highest pool number is 5, the next pool number will be 6. The output shows the PGs will not be evenly distributed because there are not enough of them. If there was a thousand times more PGs, they would be evenly distributed:

$ crush analyze --rule data --type device \
                --replication-count 2 \
                --crushmap crushmap \
                --pool 0 --pg-num 512000 --pgp-num 512000
         ~id~  ~weight~  ~over/under used %~
~name~
device4     4       1.0                 0.30
device3     3       2.0                 0.18
device2     2       1.0                -0.03
device5     5       2.0                -0.04
device1     1       2.0                -0.13
device0     0       1.0                -0.30

Increasing the number of PGs is not a practical solution because having more than a few hundred PGs per OSD requires too much CPU and RAM. Knowing that device0 will be the first OSD to fill up, reweight-by-utilization should be used when it is too full.
Continue reading “Predicting Ceph PG placement”

How many objects will move when changing a crushmap ?

After a crushmap is changed (e.g. addition/removal of devices, modification of weights or tunables), objects may move from one device to another. The crush compare command can be used to show what would happen for a given rule and replication count. In the following example, two new OSDs are added to the crushmap, causing 22% of the objects to move from the existing OSDs to the new ones.

$ crush compare --rule firstn \
                --replication-count 1 \
                --origin before.json --destination after.json
There are 1000 objects.

Replacing the crushmap specified with --origin with the crushmap
specified with --destination will move 229 objects (22.9% of the total)
from one item to another.

The rows below show the number of objects moved from the given
item to each item named in the columns. The objects% at the
end of the rows shows the percentage of the total number
of objects that is moved away from this particular item. The
last row shows the percentage of the total number of objects
that is moved to the item named in the column.

         osd.8    osd.9    objects%
osd.0        3        4       0.70%
osd.1        1        3       0.40%
osd.2       16       16       3.20%
osd.3       19       21       4.00%
osd.4       17       18       3.50%
osd.5       18       23       4.10%
osd.6       14       23       3.70%
osd.7       14       19       3.30%
objects%   10.20%   12.70%   22.90%

The crush compare command can also show the impact of a change in one or more “tunables”, such as setting chooseleaf_stable to 1.

$ diff -u original.json destination.json
--- original.json	2017-03-14 23:41:47.334740845 +0100
+++ destination.json	2017-03-04 18:36:00.817610217 +0100
@@ -608,7 +608,7 @@
         "choose_local_tries": 0,
         "choose_total_tries": 50,
         "chooseleaf_descend_once": 1,
-        "chooseleaf_stable": 0,
+        "chooseleaf_stable": 1,
         "chooseleaf_vary_r": 1,
         "straw_calc_version": 1
     }

In the following example some columns were removed for brevity and replaced with dots. It shows that 33% of the objects will move after chooseleaf_stable is changed from 0 to 1. Each device will receive and send more than 1% and less than 3% of these objects.

$ crush compare --origin original.json --destination destination.json \
                --rule replicated_ruleset --replication-count 3
There are 300000 objects.

Replacing the crushmap specified with --origin with the crushmap
specified with --destination will move 99882 objects (33.294% of the total)
from one item to another.

The rows below show the number of objects moved from the given
item to each item named in the columns. The objects% at the
end of the rows shows the percentage of the total number
of objects that is moved away from this particular item. The
last row shows the percentage of the total number of objects
that is moved to the item named in the column.

          osd.0  osd.1 osd.11 osd.13 osd.20 ... osd.8  osd.9 objects%
osd.0         0    116    180      0   3972 ...   138    211    1.89%
osd.1       121      0    129     64    116 ...   112    137    1.29%
osd.11      194    126      0     12      0 ...   168    222    1.94%
osd.13        0     75     19      0    211 ...     0   4552    2.06%
osd.20     4026    120      0    197      0 ...    90      0    1.92%
osd.21      120   2181     65    130    116 ...    85     75    1.29%
osd.24      176    150    265     63      0 ...   160    258    2.29%
osd.25      123     99    190    198     99 ...    92    182    2.19%
osd.26       54     83     62    258    254 ...    51     69    2.27%
osd.27      124    109      0     90     73 ...  1840      0    1.55%
osd.29       43     54      0     98    123 ...  1857      0    1.60%
osd.3        74     82   2112    137    153 ...    61     44    1.62%
osd.37       65    108      0      0    166 ...    67      0    1.66%
osd.38      163    119      0      0     73 ...    58      0    1.68%
osd.44       56     73   2250    148    173 ...    77     43    1.68%
osd.46       60     71    132     67      0 ...    39    125    1.31%
osd.47        0     51     70    126     70 ...     0     73    1.35%
osd.8       151    112    163      0     76 ...     0    175    1.67%
osd.9       197    130    202   4493      0 ...   188      0    2.03%
objects%  1.92%  1.29%  1.95%  2.03%  1.89% ... 1.69%  2.06%   33.29%

Continue reading “How many objects will move when changing a crushmap ?”

Predicting which Ceph OSD will fill up first

When a device is added to Ceph, it is assigned a weight that reflects its capacity. For instance if osd.1 is a 1TB disk, its weight will be 1.0 and if osd.2 is a 4TB disk, its weight will be 4.0. It is expected that osd.1 will receive exactly four times more objects than osd.2. So that when osd.1 is 80% full, osd.2 is also 80% full.

But running a simulation on a crushmap with four 4TB disks and one 1TB disk, shows something different:

         WEIGHT     %USED
osd.4       1.0       86%
osd.3       4.0       81%
osd.2       4.0       79%
osd.1       4.0       79%
osd.0       4.0       78%

It happens when these devices are used in a two replica pool because the distribution of the second replica depends on the distribution of the first replica. If the pool only has one copy of each object, the distribution is as expected (there is a variation but it is around 0.2% in this case):

         WEIGHT     %USED
osd.4       1.0       80%
osd.3       4.0       80%
osd.2       4.0       80%
osd.1       4.0       80%
osd.0       4.0       80%

This variation is not new but there was no way to conveniently show it from the crushmap. It can now be displayed with crush analyze command. For instance:

    $ ceph osd crush dump > crushmap-ceph.json
    $ crush ceph --convert crushmap-ceph.json > crushmap.json
    $ crush analyze --rule replicated --crushmap crushmap.json
            ~id~  ~weight~  ~over/under used~
    ~name~
    g9       -22  2.299988     10.400604
    g3        -4  1.500000     10.126750
    g12      -28  4.000000      4.573330
    g10      -24  4.980988      1.955702
    g2        -3  5.199982      1.903230
    n7        -9  5.484985      1.259041
    g1        -2  5.880997      0.502741
    g11      -25  6.225967     -0.957755
    g8       -20  6.679993     -1.730727
    g5       -15  8.799988     -7.884220

shows that g9 will be ~90% full when g1 is ~80% full (i.e. 10.40 – 0.50 ~= 10% difference) and g5 is ~74% full.

By monitoring disk usage on g9 and adding more disk space to the cluster when the disks on g9 reach a reasonable threshold (like 85% or 90%), one can ensure that the cluster will never fill up, since it is known that g9 will always be the first node to become overfull. Another possibility is to run the ceph osd reweight-by-utilization command from time to time and try to even the distribution.
Continue reading “Predicting which Ceph OSD will fill up first”

Testing Ceph with ARMv8 OpenStack instances

The Ceph integration tests can be run on ARMv8 (aka arm64 or aarch64) OpenStack instances on CloudLab or Runabove.

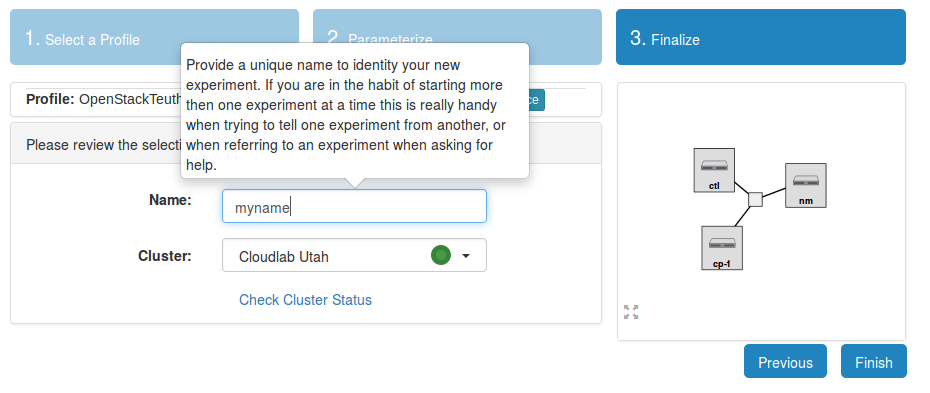
When logged in CloudLab an OpenStack cluster suitable for teuthology must be created. To start an experiment

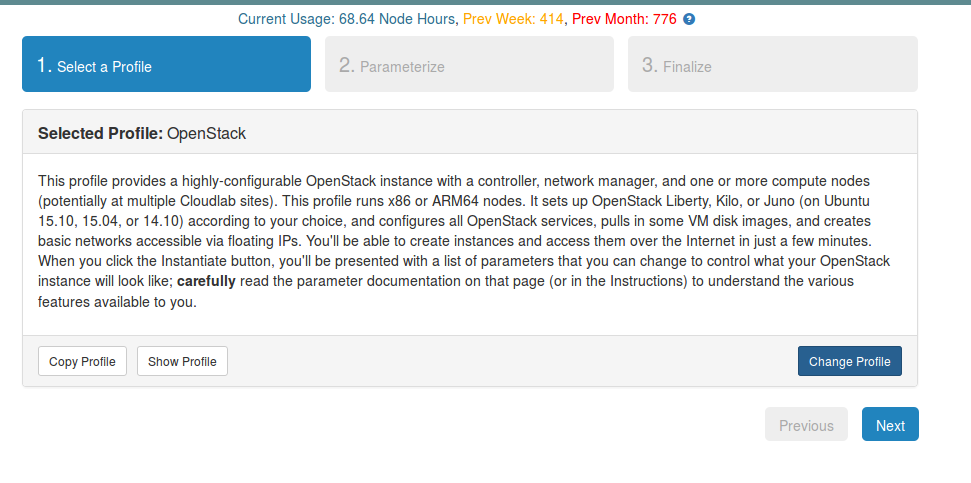
click Change Profile

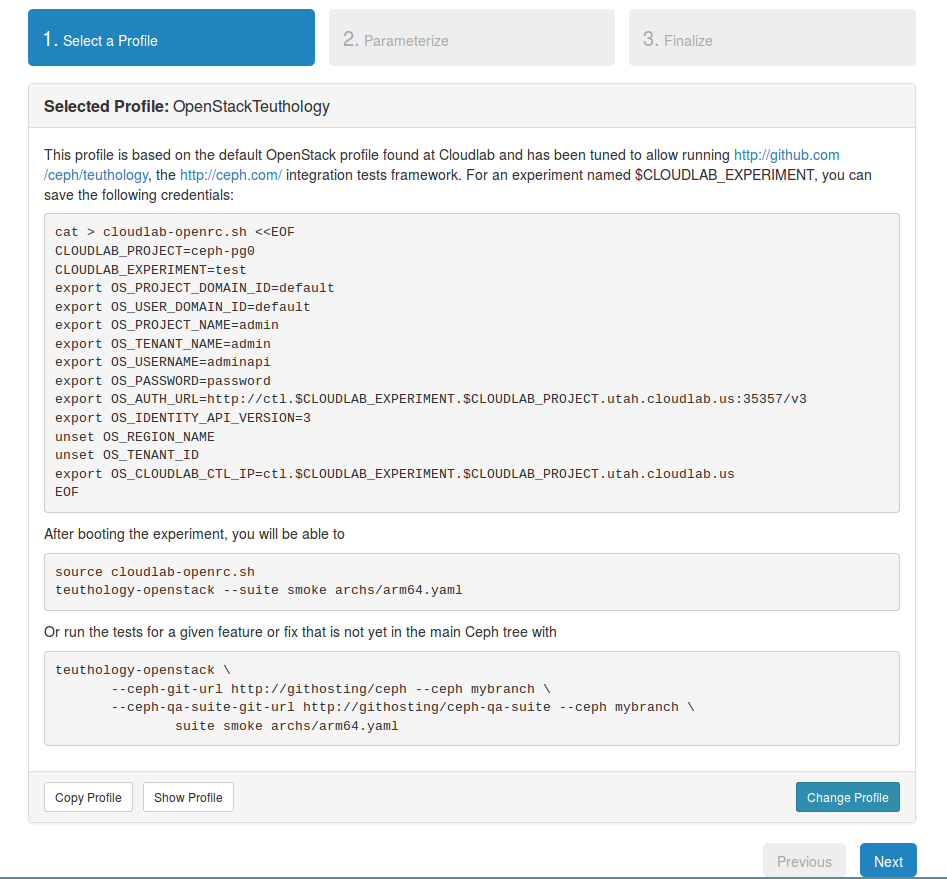
to select the OpenStackTeuthology profile

the description of the profile contains an example credential file (i.e. openrc.sh) that can be copy/pasted on the local machine

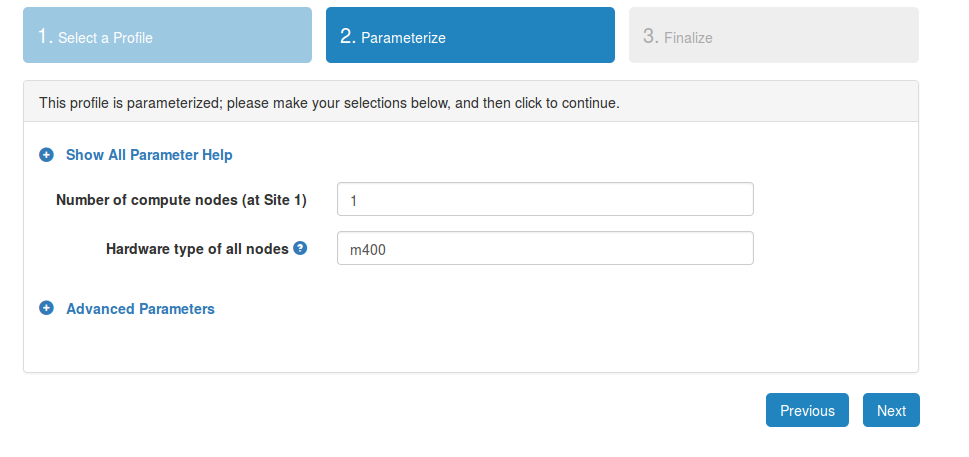
the m400 default machine type will select ARMv8 hardware

in the last step, choose a name for the experiment. The openrc.sh file must be modified to reflect the chosen name because it shows in the URL of the authentication service. If a new experiment by the same name is run a month later, the same openrc.sh file can be used.

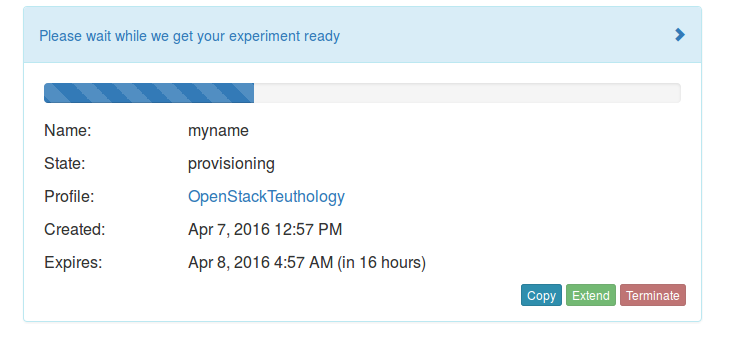
the page is then updated to show the progress of the provisionning. Note that it takes about 15 minutes for it to complete: even when the page says the experiment is up, the OpenStack setup is still going on and need a few more minutes.

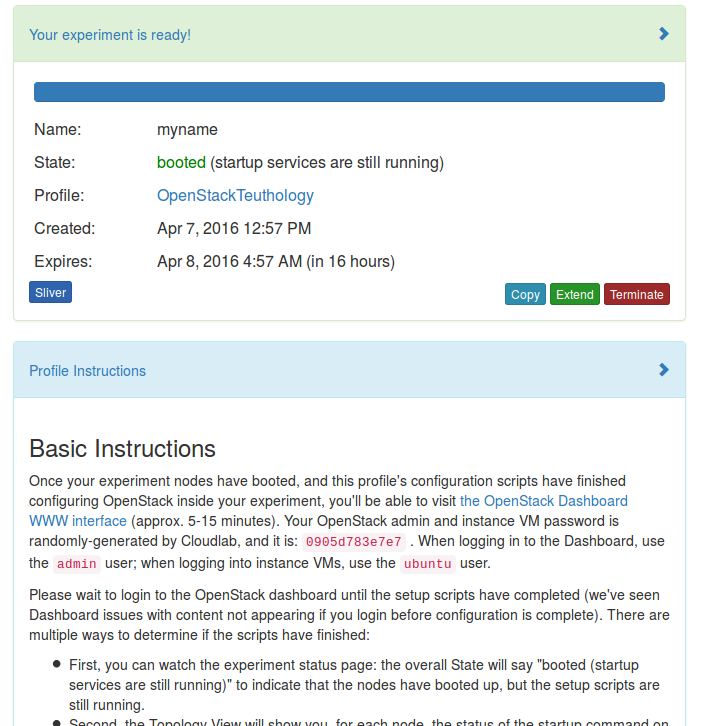
Finally click on Profile instructions to display the link to the horizon dashboard and the password of the admin user (i.e. configuring OpenStack inside your experiment, you’ll be able to visit the OpenStack Dashboard WWW interface (approx. 5-15 minutes). Your OpenStack admin and instance VM password is randomly-generated by Cloudlab, and it is: 0905d783e7e7 .).

When the cluster is created, running the smoke integration tests for rados on jewel can be done with ceph-workbench

ceph-workbench --verbose ceph-qa-suite --ceph jewel --suite smoke --filter rados

assuming the openrc.sh file has been set in ~/.ceph-workbench/openrc.sh. When the command returns, it displays the URL of the web interface

...
2016-04-07 11:25:57,625.625 DEBUG:paramiko.transport:EOF in transport thread
2016-04-07 11:25:57,628.628 INFO:teuthology.openstack:
pulpito web interface: http://128.110.155.162:8081/
ssh access           : ssh ubuntu@128.110.155.162 # logs in /usr/share/nginx/html

And when the test completes successfully it will show in green. Otherwise the logs of the failed tests can be downloaded and analyzed.

Continue reading “Testing Ceph with ARMv8 OpenStack instances”