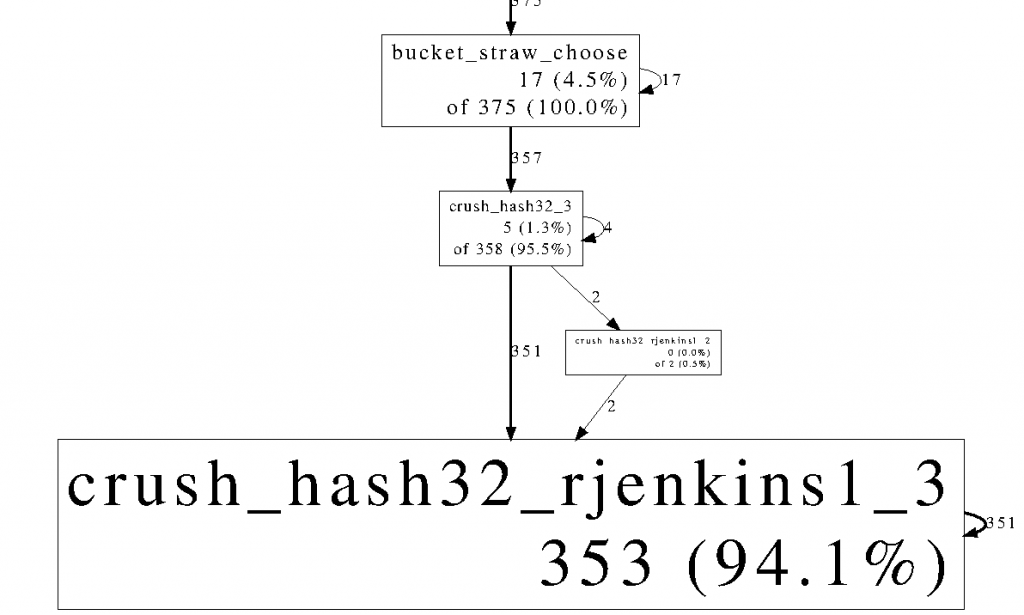
After compiling Ceph from sources with:
./configure --with-debug CFLAGS='-g' CXXFLAGS='-g'
The crushtool test mode is used to profile the crush implementation with:
LD_PRELOAD=/usr/lib/libprofiler.so.0 \
CPUPROFILE=crush.prof src/crushtool \
  -i src/test/cli/crushtool/one-hundered-devices.crushmap \
  --test --show-bad-mappings
as instructed in the cpu profiler documentation. The resulting crush.prof file can then be analyzed with
google-pprof --ignore=vector --focus=bucket_choose \
  --gv ./src/crushtool crush.prof
and displays the following result:

Any Ceph command can be profiled in this way.

